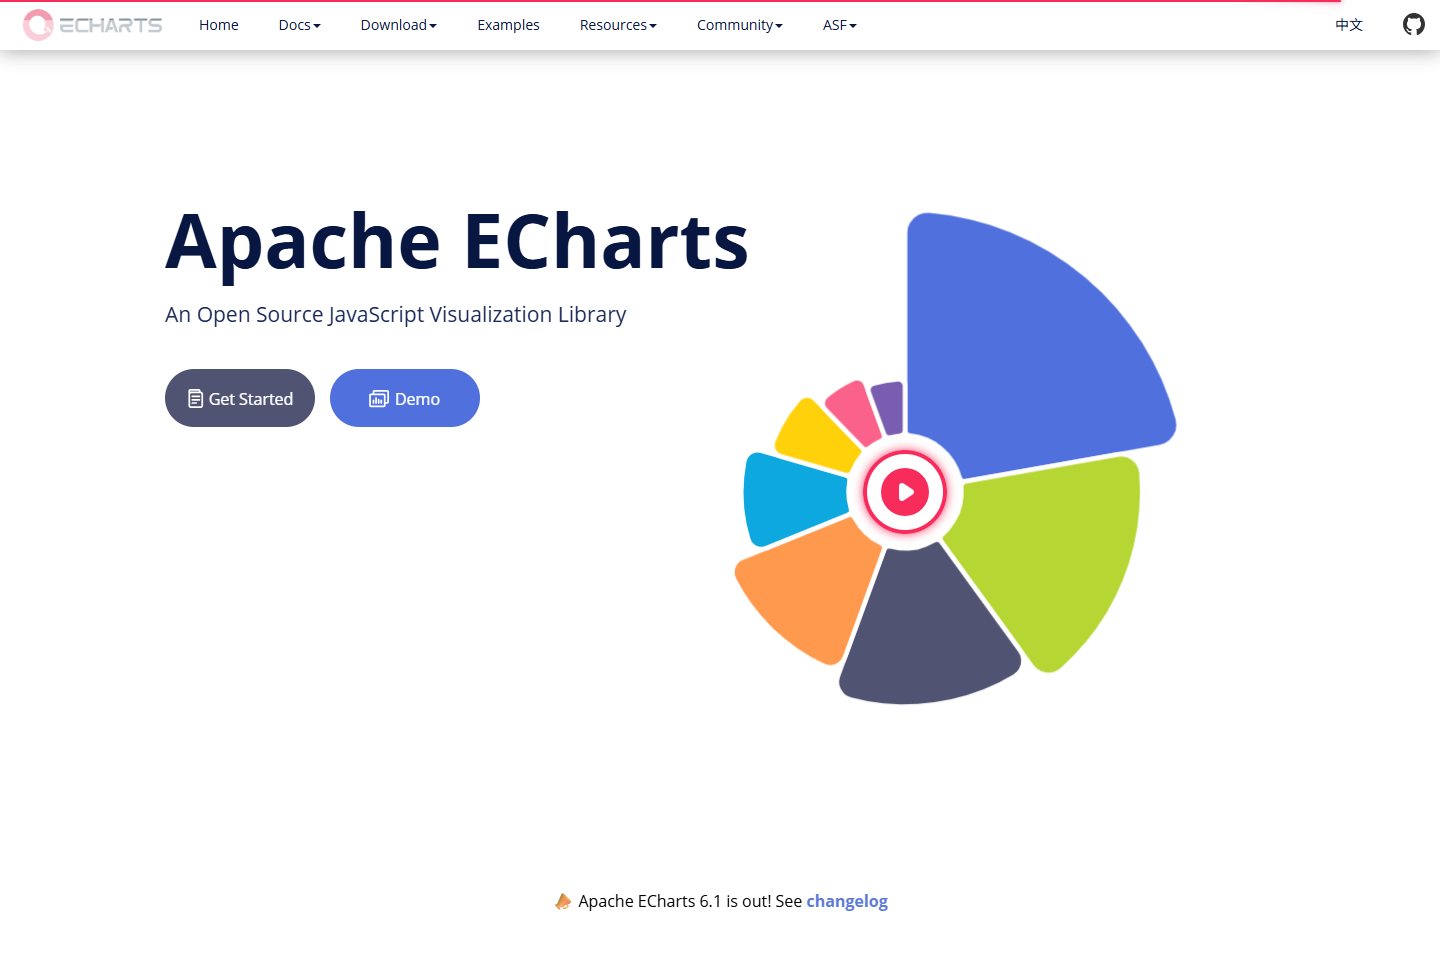
Apache ECharts is a JavaScript library for interactive charts and data visualisation.
The official examples and configuration reference cover chart types, interactions, maps and datasets. Developers can use them to build charts for web pages and dashboards.
- Sections on the website
- API reference
- Recorded website languages
- English
Official sources: echarts.apache.org